
In my earlier post on early retirement in India, I assumed an average return of 12% from investing in equity. A lot of people new to equity investing assumed that this 12% is a guaranteed rate of return like a fixed deposit which is not correct. You can find this misleading way of talking about equity returns even in popular personal finance publications.
In this post I’ll help you visualise stock market return correctly so you can also understand the risks involved in equity investing.
Imaginary F.D returns versus Stock Market returns
See below example that compares Rs.100 invested for 5 years in a 12% F.D versus stock market. I have used imaginary F.D & equity return % to make a point.
The F.D rate is guaranteed so your investment grows at 12% every year. But the stock market returns are not guaranteed and they go up and down but at the end of 5 years Rs.100 invested in the stock market gives you the same ending value as the F.D maturity amount in this imaginary example. So you can say that in this imaginary example the stock market gave you a 12% average return at the end of 5 years.
Real-life example
The 12% return I assumed in my early retirement blog post was based on a 20-year average of the Sensex from 1996-2016 and not the “year-over-year” return. Stock market returns go up and down sometimes wildly.
See below for the year-by-year returns of the Sensex from 1996 to 2016.
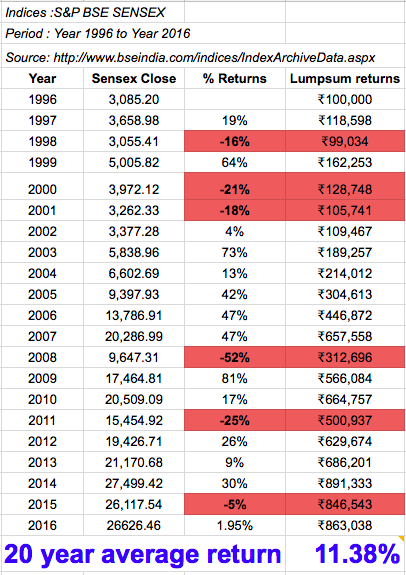
Highlights:
- Look at the “% Returns” column. You don’t see a straight line giving 12% year after year like a fixed deposit
- What you see is annual returns going up and down and in some years even negative returns.
Hmmm… the market returns fluctuate every year. How to calculate returns?
Enter CAGR: Compound Annual Growth Rate. CAGR is nothing but the annual interest rate required for lumpsum ‘X’ to grow to lumpsum ‘Y’ over a period of ‘n’ years.
Since the stock market returns are volatile, a simple way to calculate returns is to take the starting year value and calculate what “FD interest rate” would have given the ending year value. So according to the above table Rs.1 lakh invested in 1996 would have returned Rs.8.63 lakhs in 2016 which is an average return of 11.38%
Don’t worry there are online CAGR calculators: http://www.moneychimp.com/calculator/discount_rate_calculator.htm
Will my equity corpus double every 6 years at 12% return as per Rule of 72:
The Rule of 72 is easy to apply when you get a steady 12% return every year like a F.D
But when you get non-straightline returns like the stock market, your corpus will not double exactly after 6 years @ 12% average return.
Look at the Sensex returns table above:
- Rs.1 lakh invested in 1996
- Doubled to Rs.2 lakhs in 2004 after 8 years
- Doubled to Rs.4 lakhs in 2006 after just 2 years
- Doubled to Rs.8 lakhs in 2014 after 8 years
So Rs.1 lakh doubled 3 times after 18 years just as the Rule of 72 predicted for a 12% average return. If there are years when the markets are down then the doubling takes longer. That’s the main difference between stock market and FD returns. You have to account for years when the market is down while investing in the stock market.
P.S:
CAGR way of calculating returns % works only for lumpsum investments. For mutual fund SIP returns you’ll need to use XIRR. If you look at your mutual fund portfolio statement, your mutual fund-house or MF aggregators like CAMS & KARVY report XIRR returns only.


[…] are averaged over a period of time. This you may already know and we have also written about it in 12% return from stock market every year?. Returns from Equity markets are not Fixed returns like FD’s. In Equities one year you may get […]
[…] We are not really worried about the ups-and-downs as it will get smoothed out over the years like I mentioned in this post. […]